

Hottest Women in the World – Women of the 1990’s
The 1990s gave rise to some of the hottest women in the world. Moreover, these iconic beauties not only dazzled on screen but also captivated audiences with their talent and charisma.

Hottest Women in the World – Women of the 1990’s
The 1990s gave rise to some of the hottest women in the world. Moreover, these iconic beauties not only dazzled on screen but also captivated audiences with their talent and charisma.

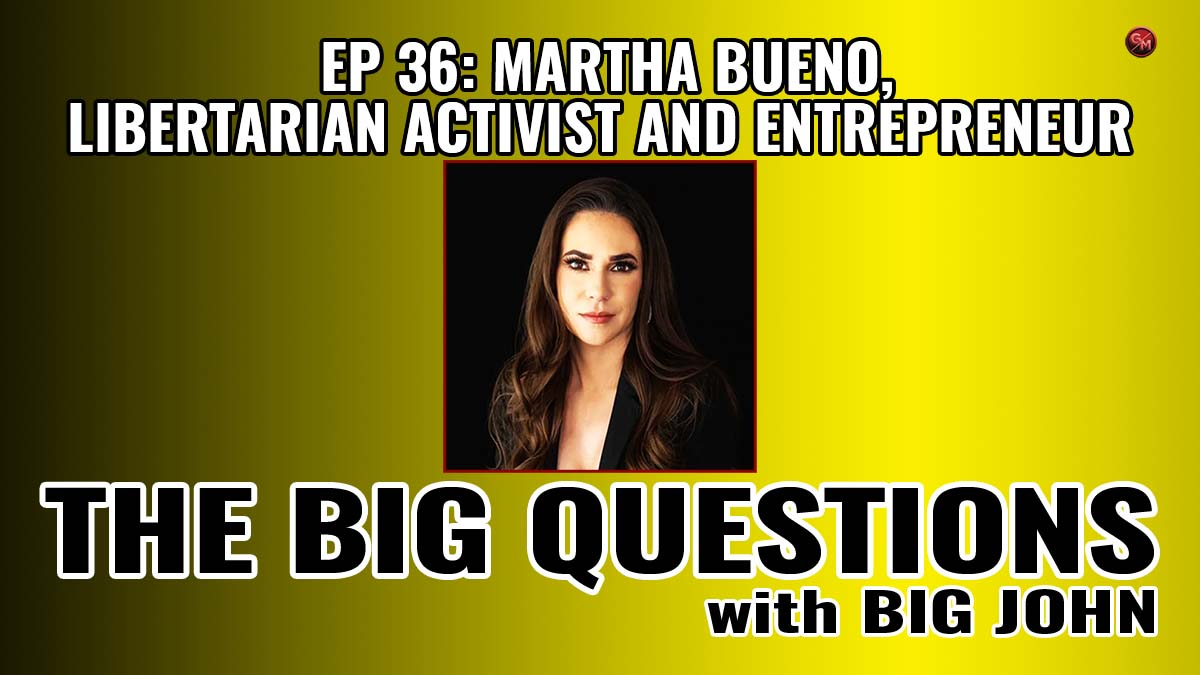
Martha Bueno, Libertarian Activist and Entrepreneur
Libertarian activist Martha Bueno, CEO of Our Good Products, Inc., discusses communism, and her journey as a Cuban-American.

Who is the NBA GOAT? The Debate RAGES! | Buzzer Beaters
In this clip, Eddie and Anthony debate the NBA GOAT! Is it Lebron James, Michael Jordan, Kobe Bryant? Or someone […]

Silly Questions with the Chair of the Libertarian Party of SF, Starchild
Get to know the Chair of the Libertarian Party of San Francisco, Starchild, as he answers our Silly Questions!
PodcastsView All
Martha Bueno, Libertarian Activist and Entrepreneur
Libertarian activist Martha Bueno, CEO of Our Good Products, Inc., discusses communism, and her journey as a Cuban-American.

FISA, the Security State, and our STOLEN Civil Liberties! | Free for All | EP 18
Prominent libertarians Jacob Hornberger and Larry Sharpe to discuss the FISA renewal, the security state, and our STOLEN civil liberties!
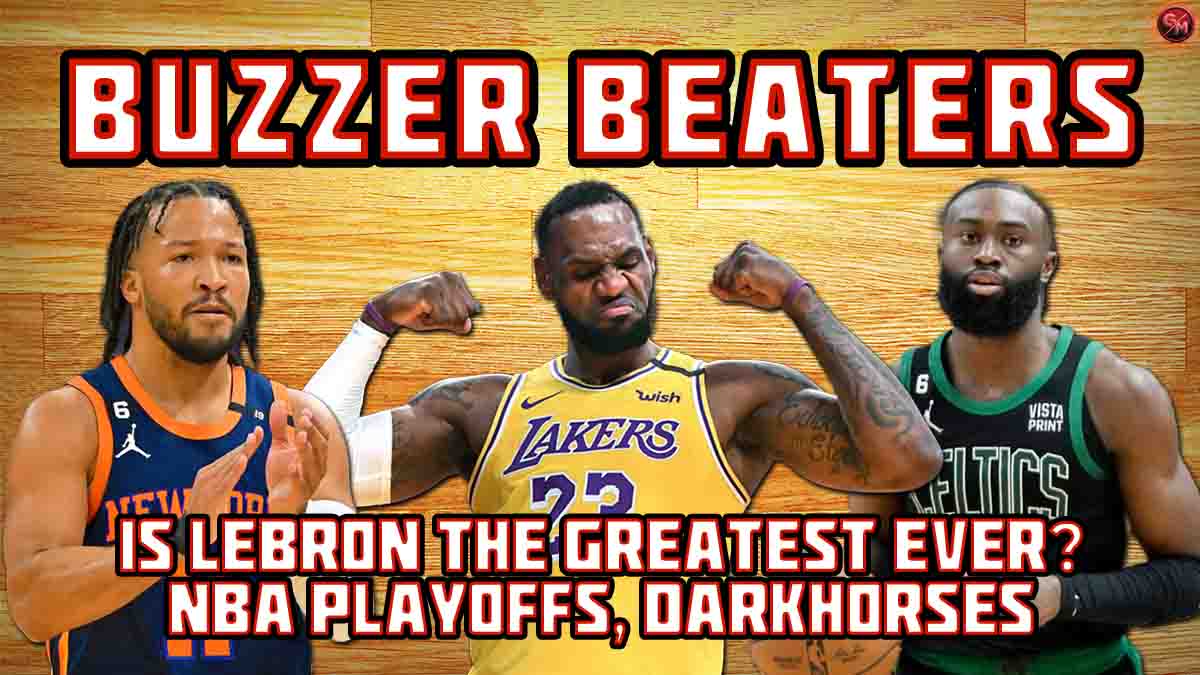
Is Lebron the GREATEST Ever? NBA Playoffs 2024, Darkhorses
In this episode of Buzzer Beaters, Eddie and Anthony discuss the NBA playoffs 2024 and make their predictions for each […]

NFL Draft 2024: Pro Scout Breaks it Down for YOU!
NFL Scout Rodrik Martin to break down some of the prospects of the 2024 NFL Draft, reveals what is in the minds of talent evaluators, and other insights into the draft process.
Most Recent ArticlesView All
Hottest Women in the World – Women of the 1990’s
The 1990s gave rise to some of the hottest women in the world. Moreover, these iconic beauties not only dazzled on screen but also captivated audiences with their talent and charisma.
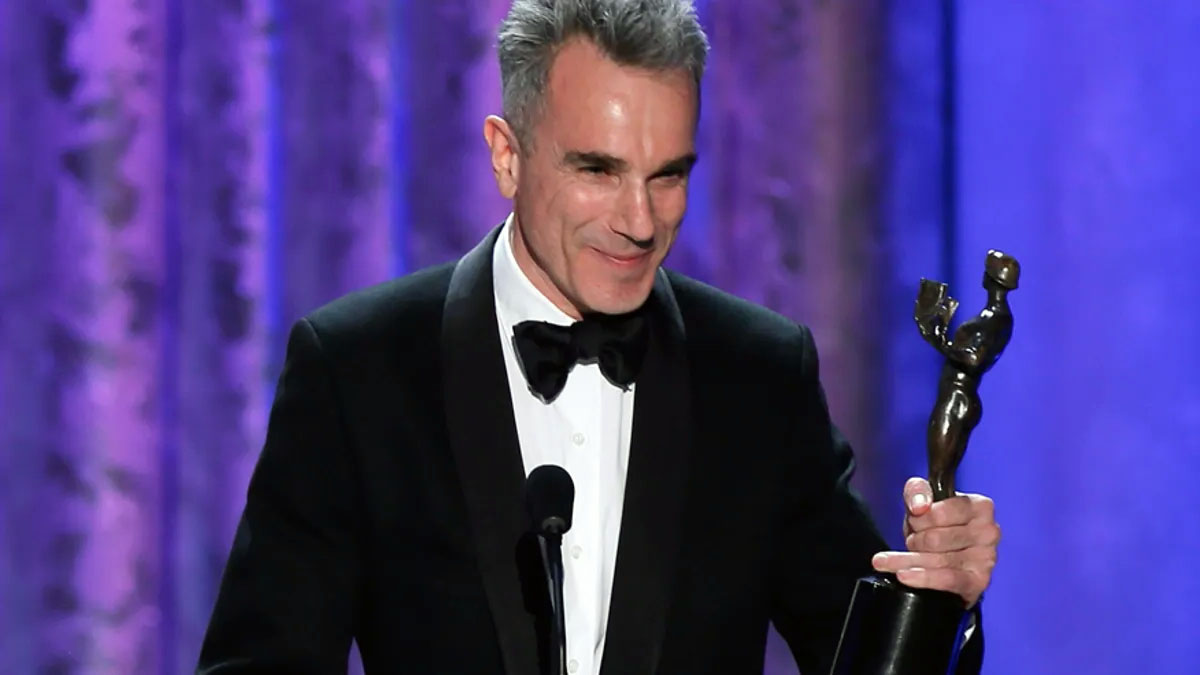
The Greatest Actors of All-Time
In cinematic history, the quest to identify the greatest actors of all-time is a journey fraught with subjective nuances and impassioned debates.
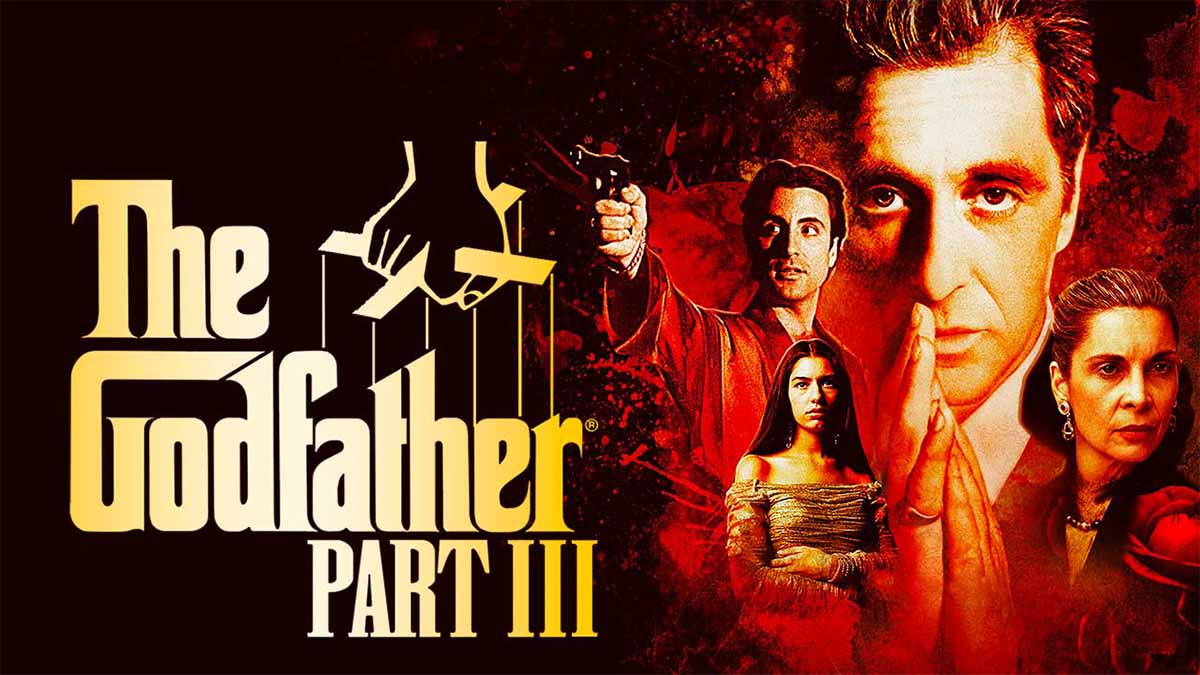
The Worst Movies of All-Time: Horrible Sequels
The worst movies of all-time: from crappy plots to awful acting, buckle up and get ready to laugh (or cry) as we unveil the worst sequels of all-time!

Hottest Women in the World – Women of the 1980’s
Welcome to our scintillating exploration of the hottest women in the world, tailored specifically for Generation Xers.
ClipsView All

Who is the NBA GOAT? The Debate RAGES! | Buzzer Beaters
In this clip, Eddie and Anthony debate the NBA GOAT! Is it Lebron James, Michael Jordan, Kobe Bryant? Or someone […]

Silly Questions with the Chair of the Libertarian Party of SF, Starchild
Get to know the Chair of the Libertarian Party of San Francisco, Starchild, as he answers our Silly Questions!

Is this how the Right and Left Will DESTROY Our Gun Rights?
Chase Oliver, Mike ter Maat, and Daniel Schmutter join host Big John in wondering if the Left and Right wings are teaming up to DESTROY our gun rights.
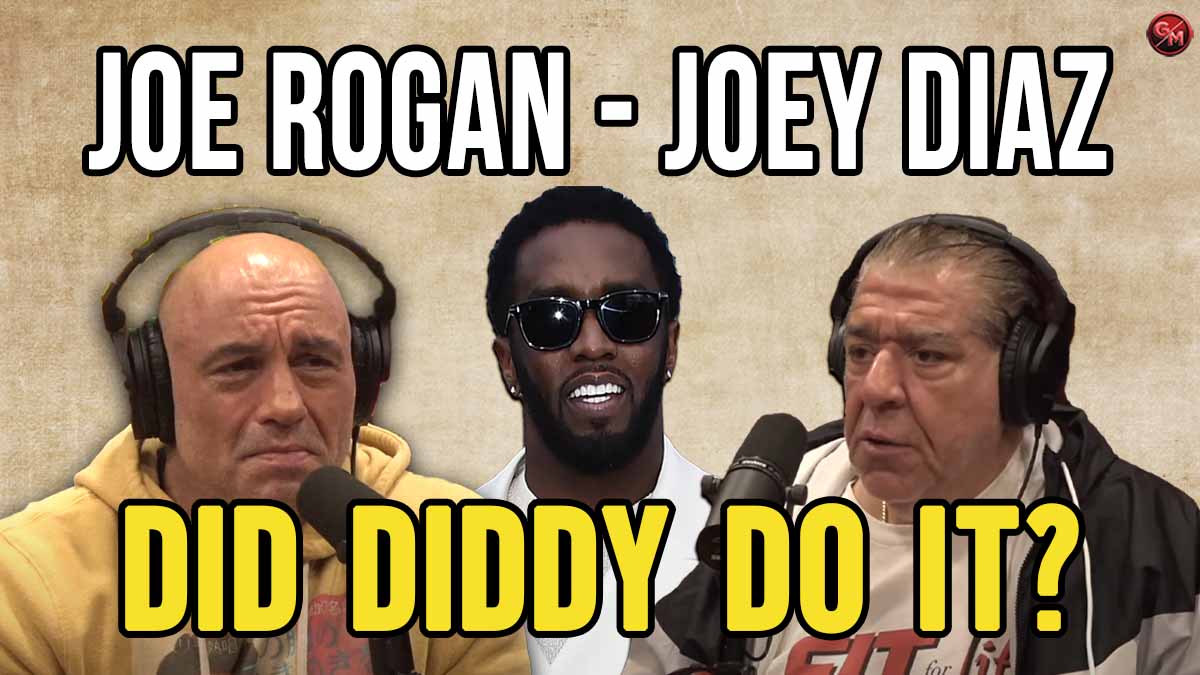
Joe Rogan & Joey Diaz: Did Diddy Do It? The SHOCKING Truth!
Joe Rogan and Joey Diaz talk about Diddy and the SHOCKING accusations against the hip-hop mogul.